TaaS will significantly lower the production price of transport miles. Initially the pricing for TaaS miles will be set just below taxi prices and will disrupt the ride hailing business. As TaaS volume grows, price will be lowered to below the current cost per mile for privately owned cars. This may be in natural monopoly situation and if so, the price will stay on about that level. The potential monopolist will in this case make large profits.
RethinkX and Tony Seba has illustrated expected cost and indicative consumer price, with the below graph which we further below suggest to adjust with three different stages in pricing.
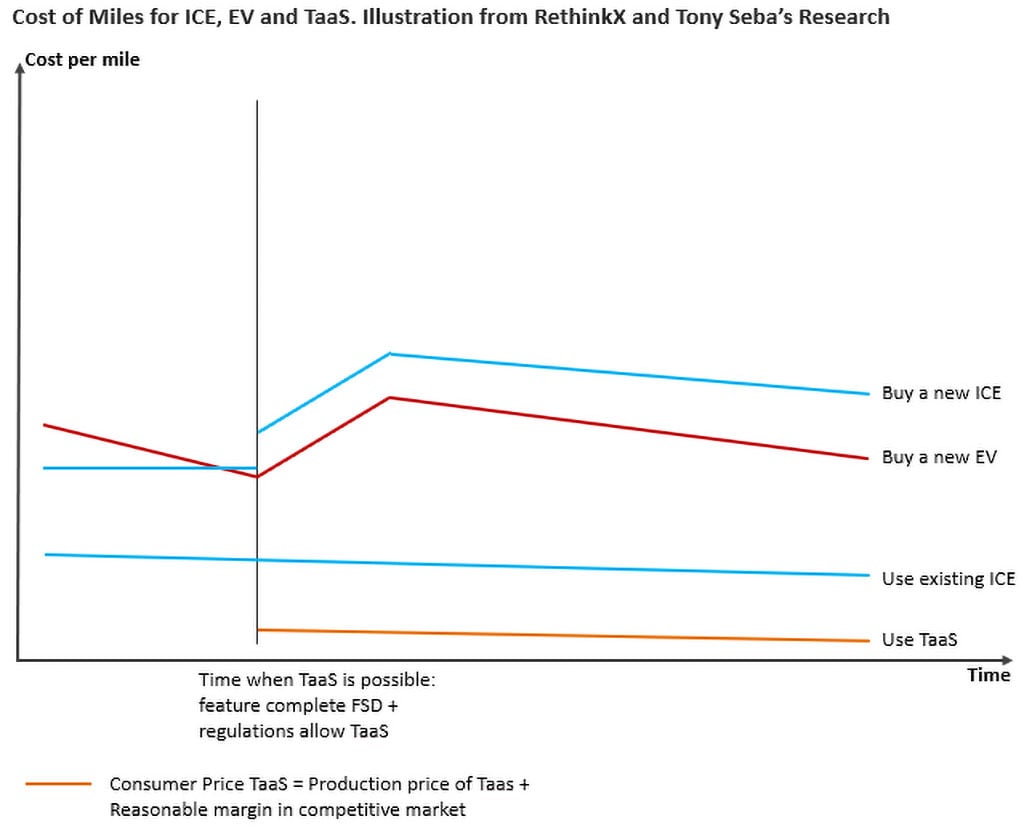
Production and Consumer Price for TaaS
Production price per mile will decrease significantly when TaaS is possible.
The diagram above indicates that the CONSUMER price decreases to long term competitive equilibrium level at the time when FSD is feature complete (+ regulations allow FSD).
In the diagram below production cost is separated from consumer price and it is suggested that this can vary in three different stages going forward.
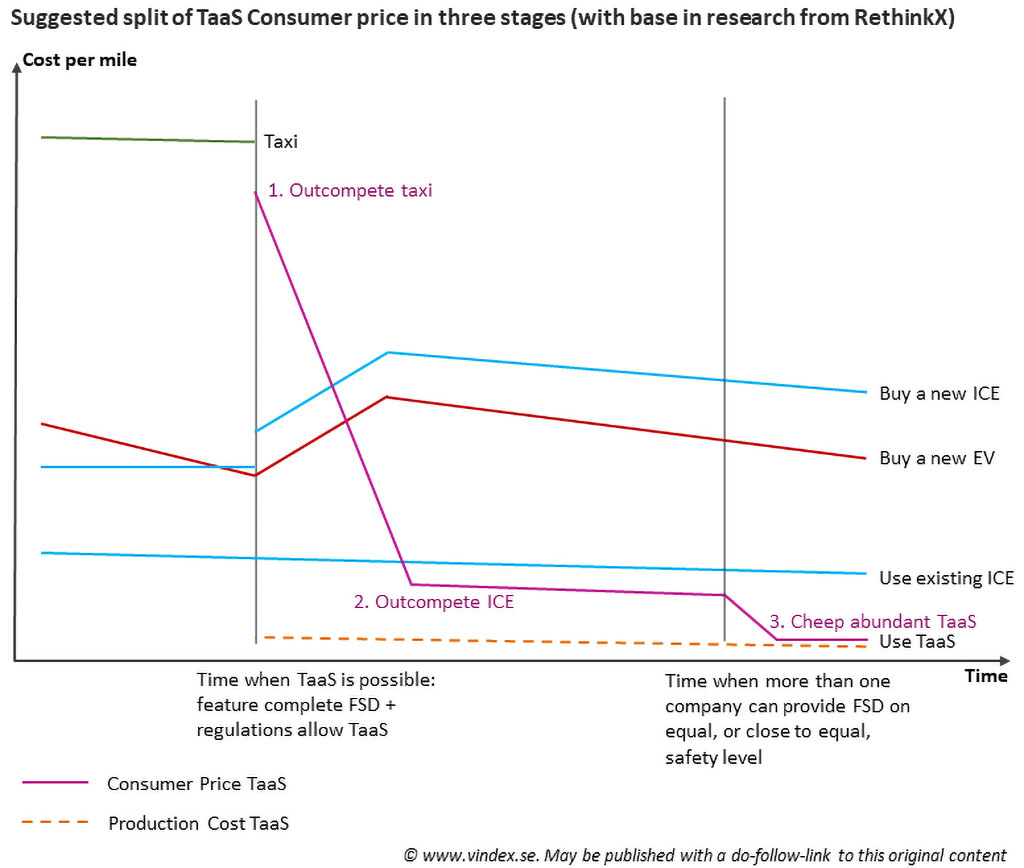
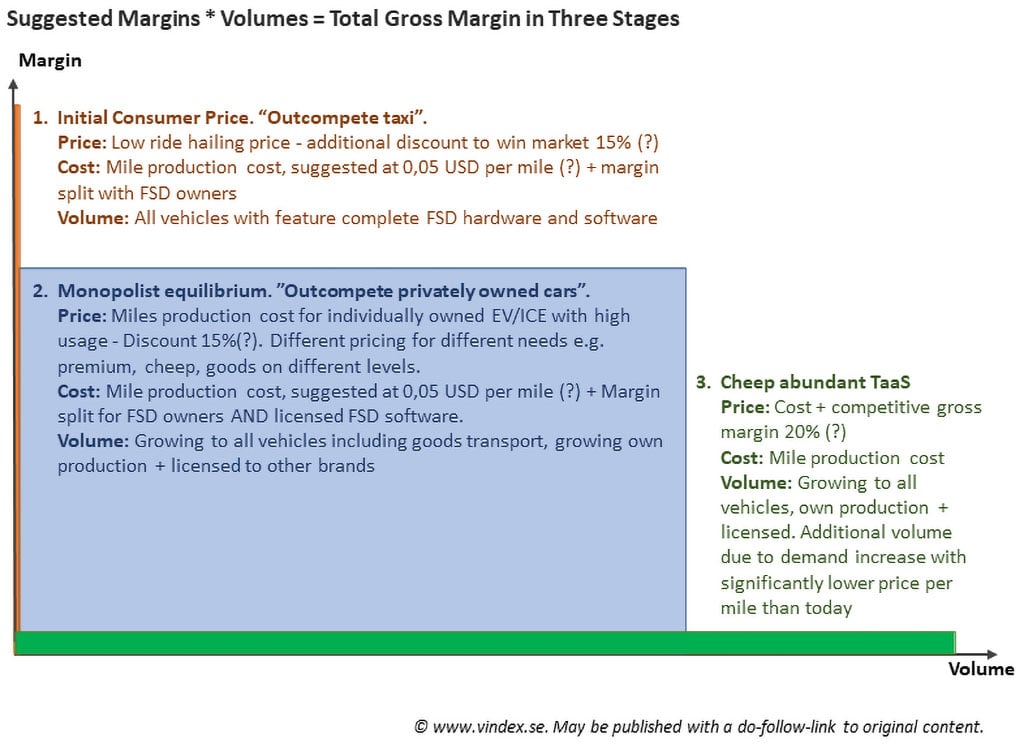
1) Initial Consumer Price. ”Outcompete taxi”.
Initially consumer price for TaaS with a limited number of vehicles will be set below current taxi/ride hailing price. Production price will already be at long term equilibrium (with room for improvement).
Margins: Very high.
Volume: Low, limited to cars with feature complete FSD hardware and software.
The consumer price will be continuously lowered towards stage 2 as production of TaaS supported vehicles increases through own production or licensed FSD.
2) Monopolist Equilibrium. ”Outcompete Privately Owned Cars”.
In this stage consumer price will be clearly lower per mile than driving a privately owned vehicle, but much higher than production cost for TaaS miles. Different pricing for different needs (e.g. comfort/cheep/goods transport).
Margins: High.
Volume: High (eventually all cars and transports). This stage may bring high company profits for a potential monopolist.
Short monopolist scenario: Several companies present FSD capability with equally good capability and security in a short time frame.
Long monopolist scenario: Comparable to Google Search adds, close to monopolist position for a long time period. Difficult for others to catch up to tech superiority and data lead.
3) Competitive Equilibrium. “Cheep Abundant TaaS”
When more FSD systems become proven as equally good, competition will set the price at production price + competitive margin.
Margins: Low
Volume: Very high (higher transport volume than current, due to low price). Volume divided on a few system providers.
Difficult to forecast when in time competitive equilibrium will occur.
Total FSD Gross Margin in These Three Stages
The schematic diagram below indicates in how (margins * volumes) may develop in these three stages. RethinkX suggests cost per mile production for TaaS at 0,03-0,05 USD per mile for TaaS in a pool solution. In the Below 0,05 has been used in text as production price. Exact cost per mile is however difficult to forecast.